|
GRAPHICAL VIEW |
This collapsible part of the screen is a graphical display of the selection you have made in the selection area. When hovering over one of the activity blocks in the graphic, more information about the specific activity will appear. When clicking on an activity block, the corresponding line in the table will be highlighted in blue. When selecting a line in the table, the corresponding activity block will be indicated as well.
When selecting an allowance, the last activity block of the selected day will be selected in the graphical overview.
The start and end registrations can now also be viewed in the graphical view.
Additional options are available in the graphical view of the activity report management module:
|
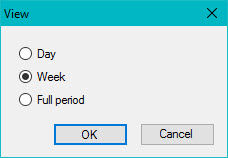
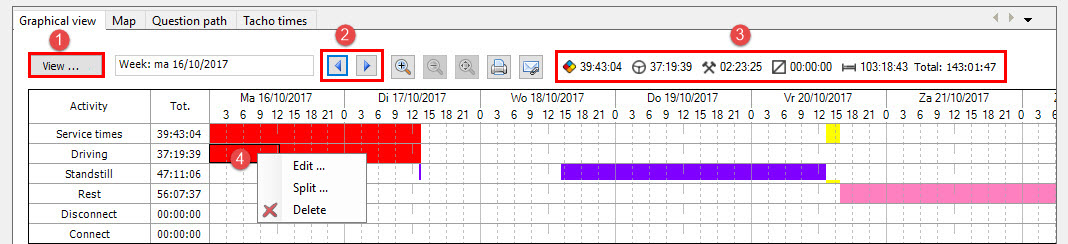
Use the View option to display the graphical overview per day, per week or for the entire selected period (= period selected in the top part of the screen (cf. selection area)).
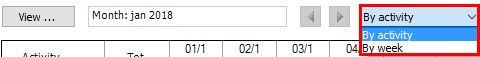
Note: By default, the selected data is displayed by activity. As from TX-CONNECT v11.41, when the selected period is larger than 7 days, the view can be grouped per week. When selected, all weeks of the selected period are displayed under each other.
|
||||||||||||||
|
Use the arrow buttons to switch to the next or previous day / week within the selected period. The arrow buttons are greyed out when "Full period" is selected in the "View" window. |
||||||||||||||
|
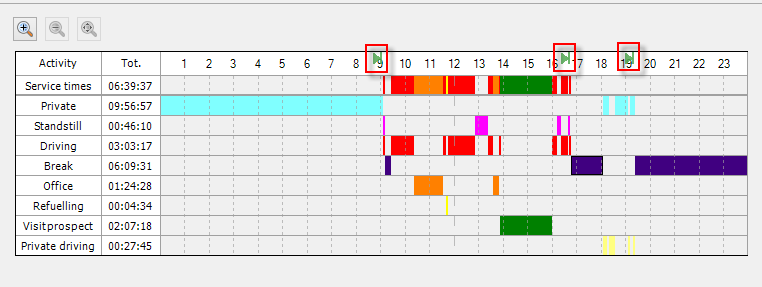
Quick overview of a driver's activities during the selected period:
Totals are not available when "Full period" is selected in the "View" selection window. |
||||||||||||||
|
|
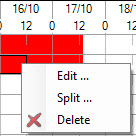
Edit |
When clicking on Edit, the Details window will open, allowing you to edit data (cf. Edit). |
||||||||||||
|
Split |
When clicking on Split, the Split activity window will open, allowing you to modify the details of the activity you want to split (cf. Split). |
||||||||||||||
|
Delete |
Delete an activity (cf. Delete). |
||||||||||||||
|
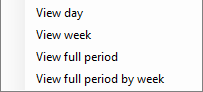
Available as from TX-CONNECT version 11.45.28 (TX-SKY and mixed fleet only):
|
|
Use these options to quickly switch between day view / week view / full period view / full period by week view. The available options depend on the selected period in the selection area. |
|||||||||||||
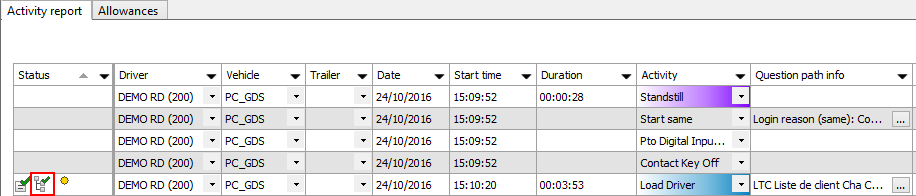
· The first column of the table (the "Status" column) contains status indicators which convey a certain message for the information line. These are the possible indicators:
|
|
Unsaved information |
|
|
Day codes |
|
|
Corrected information |
|
|
Remarks |
|
|
Click on the Save button to save the changes you made to the information. Your user name will automatically appear in the Modified by column.
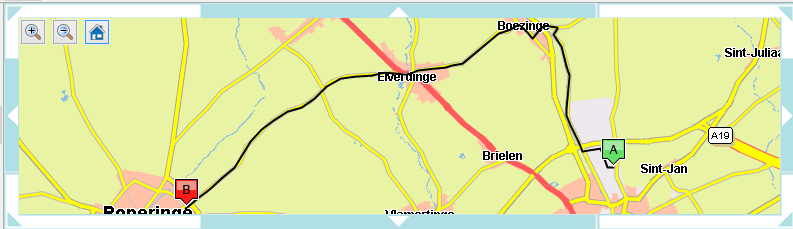
When selecting an allowance, the position of the selected activity block in the graphical overview will be shown on the map.
As from TX-CONNECT version 11, the entire route is displayed in the bottom map view when selecting the Driving activity in the upper table.
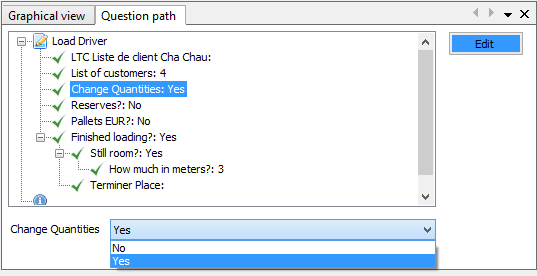
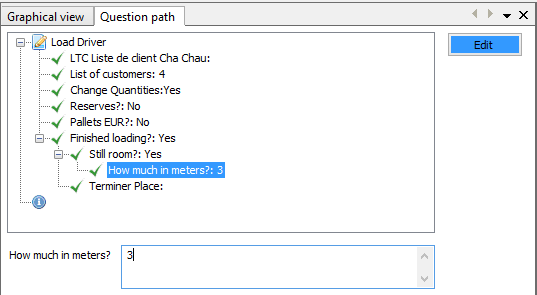
When a question path is available for an activity, the question path info will be displayed in the Question path tab at the bottom of "Activity report management" module.
Using the Question path tab, you can edit the question path info for more accurate reporting. Please note that this functionality is subject to user rights.
When you want to edit a choice, select an entry in the tree view and select Edit (= toggle button).
Edit list entry:The available options depend on the Instruction set. |
Edit text entry:Free text can be entered. |
 |
 |
You can add a comment (to clarify any modifications you may have applied) by selecting the info icon and clicking on Edit.
Add your comment in the text field at the bottom.
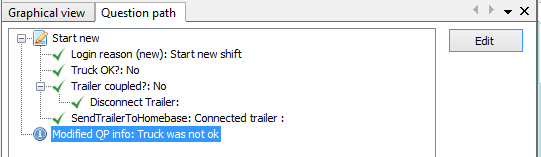

When question path info has been modified, the "Status" column in the Activity report will be updated with icon: cf. "Status column".
Important: Changes to the question path info of a planning activity will not be visible in the planning overview, as the planning overview only shows original data.
(TX-SKY only)
As from TX-CONNECT version 11.39, an additional tab page is available in the lower part of the "Activity report management" module: Tacho times.
The tacho times are only visible when searching on a driver. The new tab page is identical to Service times – Graphical view in Driver follow-up.
The data source is fixed: Original tacho data.