Each trend report screen has the same fixed structure,
in which additional data can be consulted and settings can be adjusted:
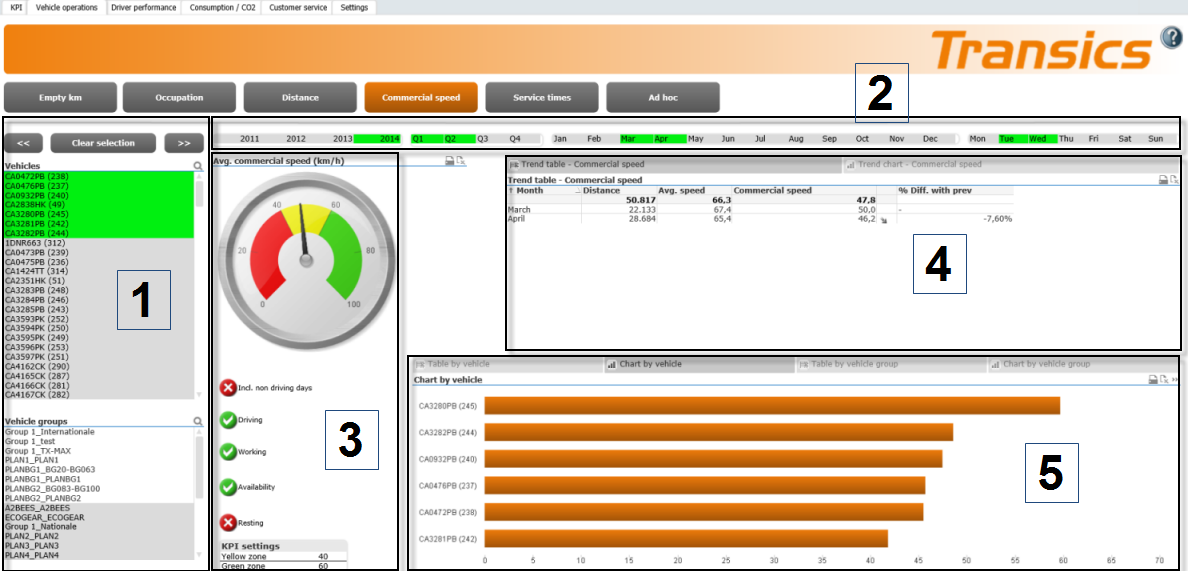
1. Vehicle selection
Select the desired vehicles / vehicle
groups from the list. |
Use drag
+ click / Ctrl + click to select multiple vehicles: |
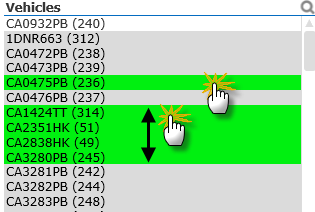
|
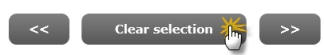
Use the navigation bar at the
top to return to the previous selection or to clear the current
selection: |
|
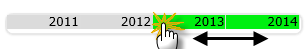
2. Period
selection
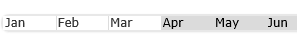
Select the desired period from the
calendar: Year, Quarter, Month, Day. |
Use drag
+ click / Ctrl + click to select multiple periods:
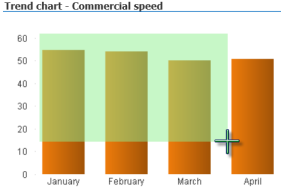
The current selection
is marked in green.
Periods that
are part of the current selection are marked in white.
Periods that
are not part of the current selection are marked in grey. |
|
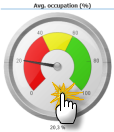
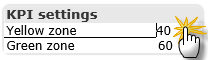
3.
Add KPIs and adjust KPI settings
Adjust the KPI settings shown in
the gauge. |
Click a KPI to add/remove it
from the gauge: |

|
Click a KPI setting to change
the Yellow/Green zone:
Note: Tap Enter
on your keyboard to confirm the modification. |
|
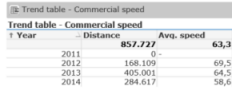
4.
Results in function of the period selection
Displays the results of the selected
period for the selected vehicles combined. |
Trend table |
|
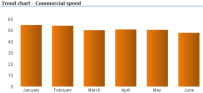
Trend chart |
|
5.
Results in function of the vehicle selection
Displays the results of the selected
period for the selected vehicles / vehicle groups separately. |
Table by vehicle / vehicle group |
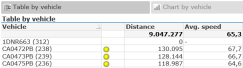
|
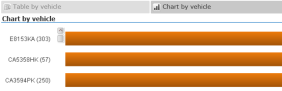
Chart by vehicle / vehicle
group |
|
Note:
Actions in charts:
Click or Drag + Click in any chart
to zoom in on the selection. |
|
To return
to the previous selection, use the
Arrow Up icon in the lower right corner:  or the selection navigation bar:
 |
|
Actions
in tables:
Click a line in a table to show only
the data for the selection. |
|