|
ECO PERFORMANCE |
This report calculates scores per driver based on ECO MONITOR data.
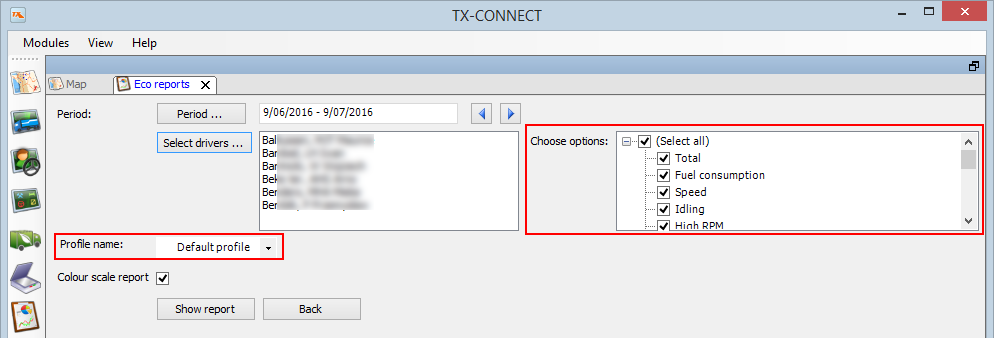 |
Available report options:
|
Note: Please note that this functionality is subject to user rights.
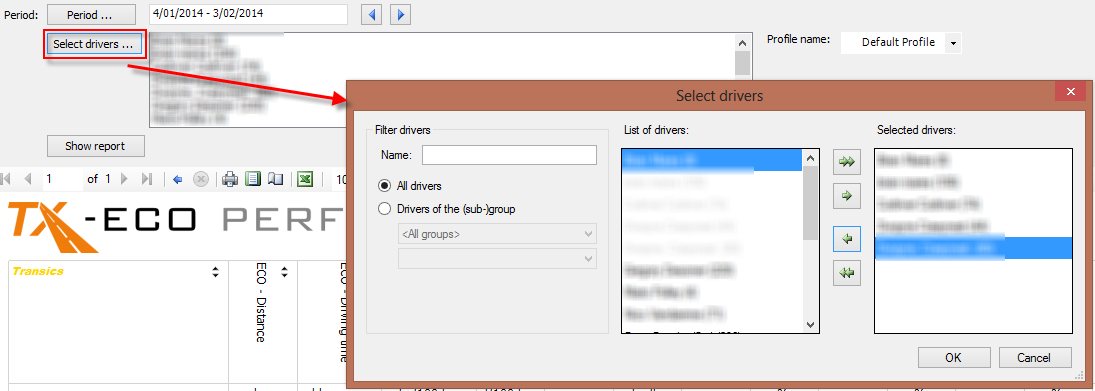
Select New to create a new profile.
Select Edit / Delete to modify or remove the selected profile.
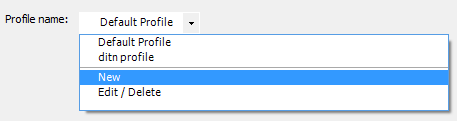
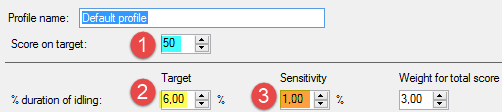
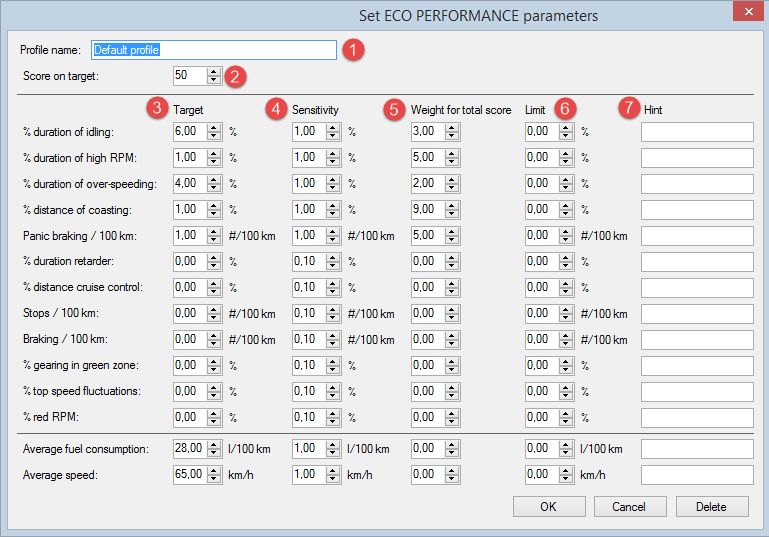
Set the desired parameters for the new profile and click OK to save. The new profile will now be available in the profile list.
Set the target value, the sensitivity and the weight for total score for every parameter:
 |
|
As from TX-CONNECT version 11.17, color scales have been added to the ECO PERFORMANCE report to improve visibility.
Select Color scale report when creating the report:
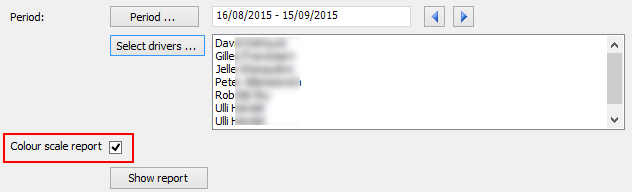
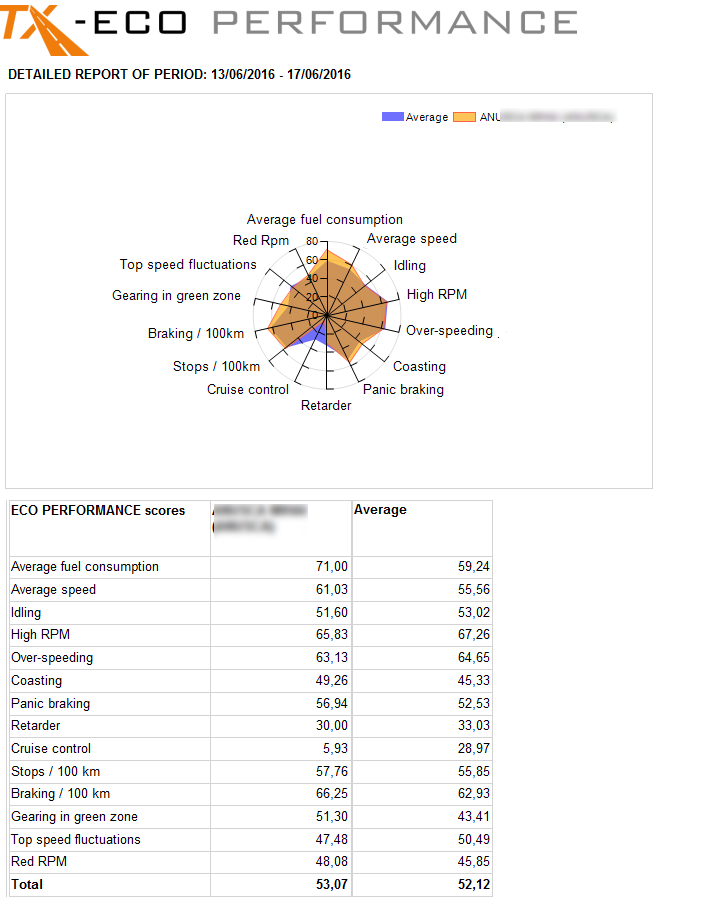
The report data are color coded according to 10 color scales. By clicking the driver's name on the left, a detailed report will be generated (cf. Detailed report below).
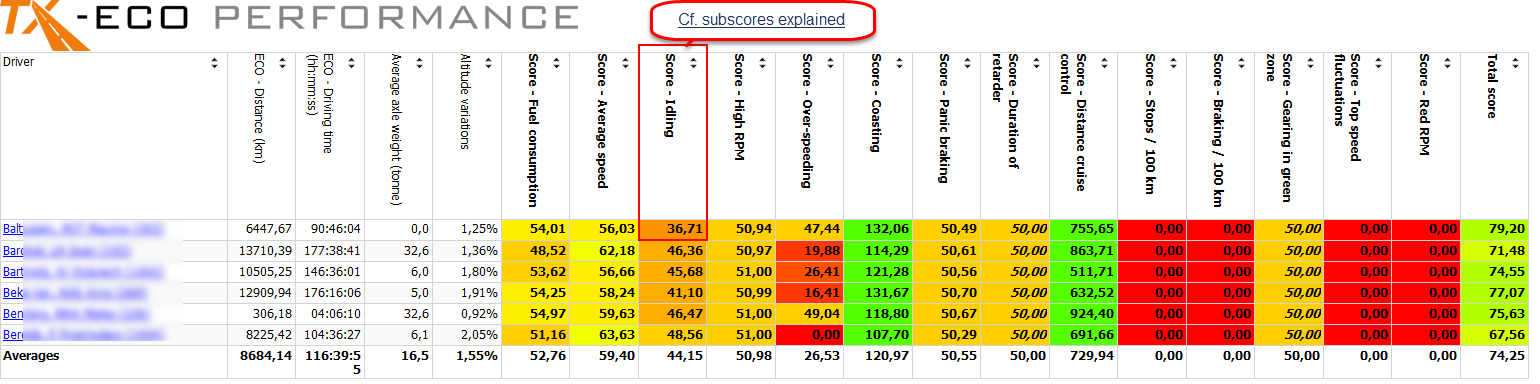
In the TX-ECO PERFORMANCE report, 4 general parameters are displayed, followed by the subscores.
| ECO - Distance (km) |
Total distance of the selected period. |
| ECO - Driving time (hh:mm:ss) |
Total driving time of the selected period. |
| Average axle weight (tons) |
Average axle weight during the selected period. This parameter provides an indication of the truck load. Heavier loads may affect fuel consumption or other subscores. |
| Altitude variations |
Using the altitude information from the GPS data, this parameter provides an indication of the altitude differences during the selected period. Higher values indicate more altitude variations which may affect fuel consumption or other subscores. |
The TX-ECO PERFORMANCE report provides a score card of the selected driving style indicators for the selected drivers. All subscores use the parameters defined in the selected profile.
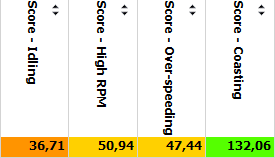
Subscores |
|
|
|
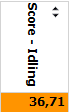
From the ECO PERFORMANCE example above: E.g. Score - Idling = 36,71
Formula for subscores: Subscore = Score on Target + (Target subscore - Actual value) / Sensitivity)
Note: For most subscores, the goal is to keep the score as low as possible, but for some parameters, the goal is to have a higher subscore, i.e. "Average speed", "Coasting", "Distance cruise control". In these cases, the above formula is slightly different: Subscore = Score on Target - (Target subscore - Actual value) / Sensitivity) |
|
|
Profile parameters of the selected profile (cf. Set profile):
Subscore = Score on Target + (Target subscore - Actual value) / Sensitivity)
=> Subscore calculation: 50 + (6 - 19.29) / 1 = 36.71
Note: The actual value (here: 19.29) used in the calculation is based on the ECO MONITOR data, which can be consulted in the ECO MONITOR report - Driver level - Permanent monitoring. When comparing results, make sure you have selected the same period and the same driver. |
|
|
In this example, a score of 36.71 is awarded to this driver for the Idling Score. As the overall "Score on target" of 50 was not reached, the score is displayed in orange (= below target). The same color codes are applied to other scores. |
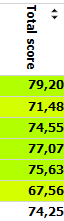
Total score |
|
|
|
The total score takes into account the "Weight for total score" set in the report profile (cf. Set profile):
|
Toolbar buttons
|
|
Back to parent report |
|
Print layout |
|
|
Stop rendering |
|
Page set-up |
|
|
|
|
Export to Excel |
 |
Next / Previous page First / Last page |
||
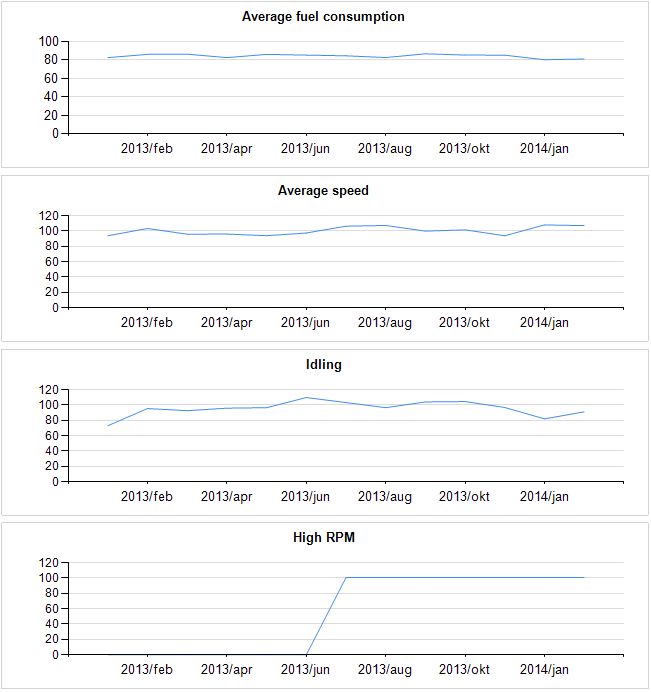
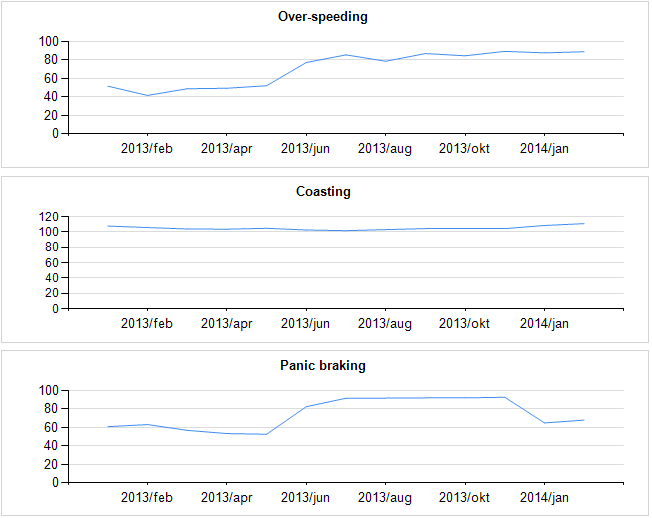
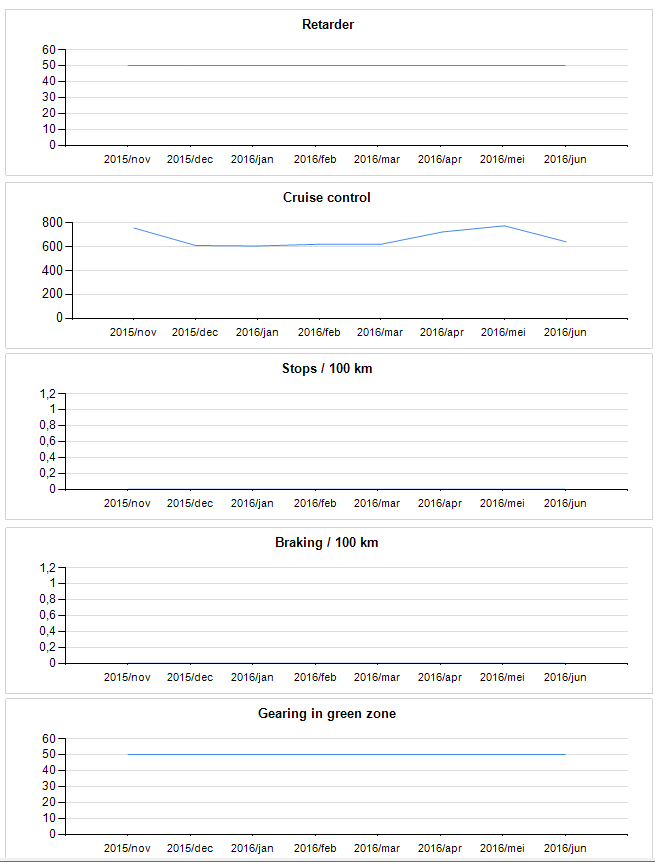
This report contains a radar chart showing the trend and evolution compared to the fleet average as well as a line chart per driving parameter.