|
VEHICLE LEVEL - |
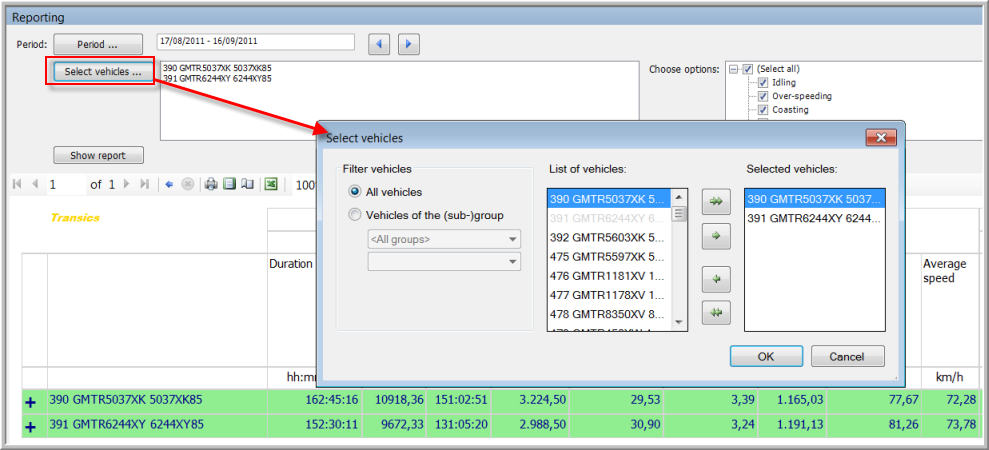
This report contains detailed information on all completed trips, including training trips, from the vehicles' point of view. Here again, the upper part allows you to select the vehicle(s), the period and the optional parameters you want to include in the report. Click on the Show report button to generate the report.
Note: As long as not all data of a day / week / month were received and treated, these data will not be visualized. That's why it is possible that the day after, there are still no data available for the day / week / month before.
Visualization
Toolbar buttons
|
|
Back to parent report |
|
Print layout |
|
|
Stop rendering |
|
Page setup |
|
|
|
|
Export to Excel |
The report
The "Scope" column contains driving data on the selected vehicle(s). "T" stands for Trip data and "C" for Continuous data . The Continuous data show all details on a vehicle, while the Trip data only contain details on a specific training trip the vehicle has completed.
Transics detects possible anomalies of the data, such as:
Missing registrations
Invalid data:
Distance jumps
Fuel jumps
Time jumps
Invalid values
The accuracy of the data is reflected by using a confidence indicator (![]() /
/ ![]() ).
).
The green line in the report contains the total of all values referring to this vehicle, except for the fields expressing an average value (Average speed, Average fuel consumption). For these fields, the weighted mean is calculated. Only values with a green confidence indicator are used to calculate these values.
Please note that a report may cover several pages, so it is possible that part of the results figures on the next page.
|
General |
• Duration of trip |
|
Total trip duration |
|
• Duration of driving |
|
Total duration of driving (Driving: speed > 2 km/h) |
|
|
• ECO - Distance |
|
Total trip distance |
|
|
• Total fuel consumption |
|
Total fuel consumption during trip |
|
|
• Average fuel consumption (l/100 km) |
|
Average fuel consumption during trip |
|
|
• Average fuel consumption (km / l) |
|
Average fuel consumption during trip |
|
|
• Average CO2 emission |
|
2.63 kg/l * fuel consumption l/100 km (in g/km) |
|
|
• Gearing overview |
ECO V2 |
Graphical overview of the most used gears:
|
|
|
• Engine load |
ECO V2 |
Graphical overview of the RPM values versus the engine load (%) Avoid high RPM with a low engine load and low RPM with a high engine load |
|
|
• Green - RPM |
ECO V2 |
% in green RPM zone |
|
|
• Yellow - RPM |
ECO V2 |
% in yellow RPM zone |
|
|
• Red - RPM |
ECO V2 |
% in red RPM zone |
|
|
• Average axle weight (tons) |
ECO V2 |
Average axle weight during trip |
|
|
• Altitude variations |
ECO V2 |
Using the altitude information from the GPS data, these parameters provide an indication of the altitude differences during the selected period. Higher values indicate more altitude variations, which may affect fuel consumption or other subscores. |
|
|
• Elevation gain (m) |
ECO V2 |
The number of meters the vehicle went uphill |
|
|
• Elevation loss (m) |
ECO V2 |
The number of meters the vehicle went downhill |
|
|
• Average RPM |
|
Sum of received RPM values / amount of received RPM values (Only counted if RPM > 0) |
|
|
• Average speed |
|
Sum of received speed values / amount of received speed values (Only counted if speed > 2 km/h) |
|
|
Fuel consumption |
• Total fuel consumption while driving (l) |
Total fuel consumption during trip (only when driving) |
|
|
• Average fuel consumption while driving (l/100 km) |
Average fuel consumption during trip (only when driving) |
||
|
• Average fuel consumption while driving (km/l) |
Average fuel consumption during trip (only when driving) |
||
|
Idling |
• Duration of idling |
|
Vehicle is idling when RPM > 0, speed < 2 km/h and PTO is off |
|
• % duration of idling |
|
(Duration of idling / duration of trip) * 100 |
|
|
• Fuel Idling |
Total fuel consumption during trip (only when idling) |
||
|
• Duration of idling + PTO |
Duration of idling and PTO on |
||
|
• % duration of idling + PTO |
(Duration of idling and PTO on / duration of trip) * 100 |
||
|
• Fuel Idling + PTO (l) |
Fuel consumption during idling and PTO on |
||
|
• Idling > threshold |
Duration of idling above configured idling threshold |
||
|
• Number of long idling |
|
Long idling: idling > 3’ |
|
|
• Long idling per day |
|
(Number of long idling / duration of trip) * 86400 |
|
|
Over-speeding |
• Duration of speed > threshold |
|
Total time above configured speed threshold |
|
• % duration of over-speeding |
|
(Total time above speed threshold / duration of driving) * 100 |
|
|
• Speed > threshold |
|
Amount of times the configured speed threshold was exceeded |
|
|
Coasting |
• Distance coasting |
|
Distance driven without accelerator pressed (coasting) - criteria: - Driving (speed > 2 km/h), - Brake switch off (no braking detected), - Clutch pedal not pressed (0 %), - Accelerator pedal not pressed (0 %), - No fuel consumption (< 2 l/h), - Cruise control off |
|
• Duration of coasting |
|
Duration driven without accelerator pressed |
|
|
• % distance - Coasting |
|
(Distance coasting / total trip distance) * 100 |
|
|
Cruising |
• Duration of cruise control |
|
Total duration using cruise control |
|
• Distance of cruise control |
|
Total distance using cruise control |
|
|
• % distance - Cruising |
|
(Distance cruising / total trip distance) * 100 |
|
|
Average fuel consumption - Cruising (l/100km) |
|
(Only TX-SKY / Mixed fleet) |
|
|
Average fuel consumption - Cruising (km/l) |
(Only TX-SKY / Mixed fleet) |
||
|
Anticipation |
• Duration travelled by braking |
|
Total duration of trip while braking |
|
• Distance travelled by braking |
|
Total distance of trip while braking |
|
|
• % distance - Braking |
|
(Total distance braking / total trip distance) * 100 |
|
|
• Number of braking |
|
Amount of times the brake was used |
|
|
• Braking / 100 km |
|
(Amount of times the brake was used / total trip distance) * 100 |
|
|
• Duration of high RPM no fuel |
|
Duration of engine braking |
|
|
• Duration of retarder |
|
Total duration the retarder was used |
|
|
• % duration of retarder |
|
(Duration of retarder / duration of driving) * 100 |
|
|
• Number of stops |
|
Stop: speed < 2 km/h |
|
|
• Stops / 100 km |
|
(Amount of stops / total trip distance) * 100 |
|
|
• Number of panic braking |
|
Amount of times that the configured panic braking threshold was exceeded (default: 1,5 m/s²) |
|
|
• Panic braking / 100 km |
|
(Amount of panic braking / total trip distance) * 100 |
|
|
Gearing |
• Number of gearings |
|
Amount of gear changes |
|
• Gear changes / 100 km |
|
(Amount of gear changes / total trip distance) * 100 |
|
|
• Number of gearings (upwards) |
|
Amount of upward gear changes |
|
|
• Number of gearings in green zone (upwards) |
ECO V2 |
Number of gear changes performed within +/- 30% of the green zone low |
|
|
• Number of gearings (downwards) |
ECO V2 |
Amount of downward gear changes |
|
|
• Number of gearings in green zone (downwards) |
ECO V2 |
Number of gear changes performed within +/- 30% of the green zone high |
|
|
• Distance in green zone |
ECO V2 |
Distance within configured minimum and maximum RPM zone |
|
|
• % distance in green zone |
ECO V2 |
Distance within minimum and maximum RPM zone / Total distance |
|
|
• Average position of the accelerator |
|
Sum of received accelerator positions / amount of received accelerator positions |
|
|
• Maximum position of the accelerator |
|
Maximum accelerator position received |
|
|
• Top speed RPM |
ECO V2 |
Average RPM in top zone speed (85-90 km/h) |
|
|
• Duration per gear (1 - 16) |
ECO V2 |
Duration in every gear |
|
|
PTO |
• Number of PTO |
Amount of PTO applications |
|
|
• Fuel consumption - PTO - Standstill (l) |
Fuel consumption of PTO during standstill |
||
|
• Fuel consumption - PTO - Standstill (l/h) |
Fuel consumption of PTO during standstill |
||
|
• Duration of PTO - Standstill |
Total duration of PTO during standstill |
||
|
• Duration of PTO - Driving |
Total duration of PTO during driving |