|
TX-REPORTS |
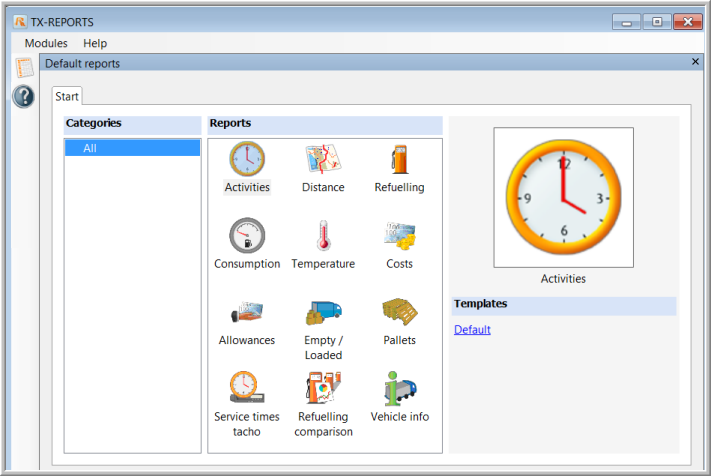
The TX-REPORTS application contains a module with default reports.
|
DEFAULT REPORTS |
|
|
An overview of the activities (and registrations) with their respective duration. This report can be created per driver, vehicle, trailer or trip. |
|
|
An overview of the kilometres driven per vehicle. This report can be created per vehicle. You can request an overview per day, week or month. |
|
|
A refuelling overview with the respective number of litres and the fuel type. This report can be created per vehicle. |
|
|
The fuel consumption in litres and the distance travelled are shown. You can request an overview per day, week or month. This report can be created per vehicle. |
|
|
An overview of the temperature registrations in the selected period. This report can be created per vehicle and trailer. |
|
|
An overview of the costs made by the driver. This report can be created per driver. |
|
|
An overview of the allowances for a driver. This report can be created per driver. |
|
|
An overview of the number of empty, loaded, solo or "unknown" kilometres. You can request an overview per day, week or month. This report can be created per vehicle. |
|
|
An overview of the loaded and unloaded pallets with the respective type of pallet. This report can be created per vehicle and driver. |
|
|
A detailed overview of the service times according to the tacho registrations with the respective durations. This report can be created per driver. |
|
|
A comparison between the consumption according to the CAN bus and the consumption as stated by the driver when refuelling. |
|
|
An overview of the most important technical properties of a vehicle. This report can be created per vehicle. Note that this report is only available in English. |
Create a report:
Double-click on the requested report icon to open the default template or simply select the report icon and choose the "default" or a "customised" template on the right.
Fill in the required fields; select the period and click "Finish".
The progress bar indicates that the report is being generated.
The report contains 2 tab pages:
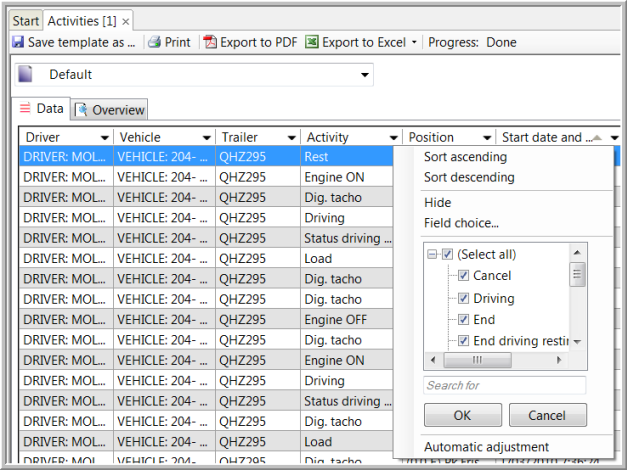
The "Data" tab page contains all treated data which will be used in the report. Here you can add or delete columns and change their position. You can save this template by clicking the Save template as ... button.
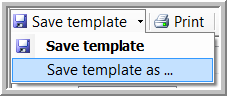
From this moment, the new template will also be available in the start screen.
The accuracy of the data is reflected by a confidence indicator ( /
/  ).
).
The "Overview" tab page contains the actual report. Here it is also possible to save the modified layout as a new template.
In both tab pages, you can choose to Print, Export to PDF or Export to Excel. When exporting to Excel, you have several options:

If you want to export the data grid, you can create a new Excel file or update an existing file (by browsing for it). When you update an existing file, the data will be exported to the first empty row of the first tab page in the Excel file. Make sure that the file you are updating is not opened in Excel.
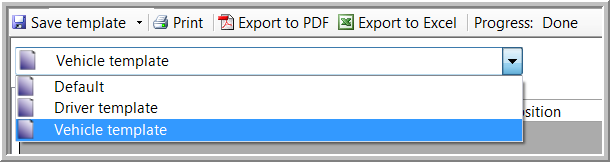
Furthermore you can choose another template in the tab pages after generating the report, by selecting a template in the drop-down menu:
It is also possible to filter and sort the data in the Data view:
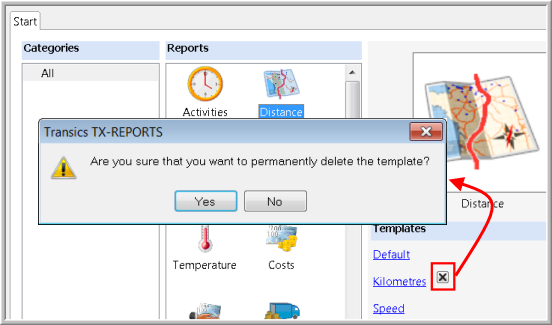
Delete a report template:
Move your mouse pointer over the template to make the Delete symbol appear. When clicking the symbol, you will be asked to confirm.
Note that it is impossible to delete a default template.