|
DRIVER LEVEL - |
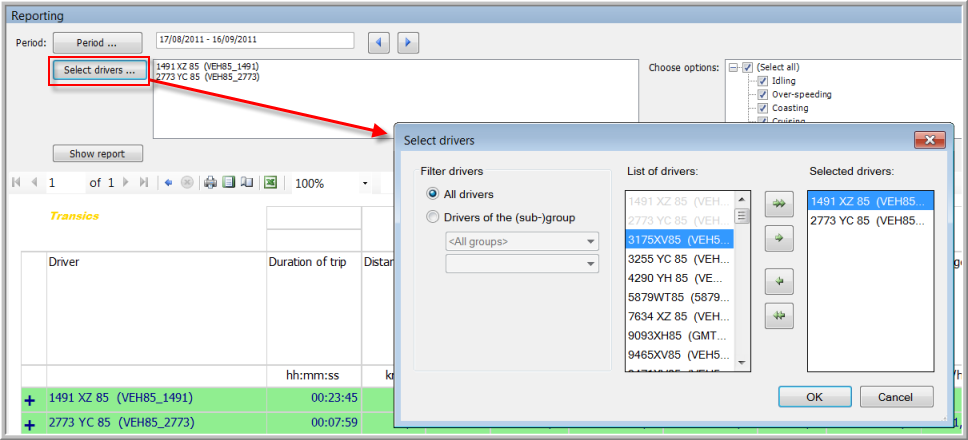
This report contains detailed information on all completed trips, including training trips, from the drivers' point of view. Here you can see for example which trips they have completed in which vehicle. In the upper part of the screen it is possible to select the driver(s) for whom you wish to draw up a report. The optional parameters can be useful to analyse their driving behaviour. Click on the button Show report to generate the report.
Visualisation
Toolbar buttons
|
|
Back to parent report |
|
Print layout |
|
|
Stop rendering |
|
Page setup |
|
|
|
|
Export to Excel |
The report
The "Scope" column contains information on the driving data of the selected driver(s). "T" stands for Trip data and "C" for Continuous data. The Continuous data show all driving details of a driver, while the Trip data only contain details on a specific training trip the driver has completed.
In the "Confidence indicator" column, Transics detects possible anomalies in the data, such as:
Missing registrations
Invalid data:
Distance jumps
Fuel jumps
Time jumps
Invalid values
The accuracy of the data is reflected by using a Confidence indicator ( /
/  ).
).
The green line in the report contains the total of all values referring to this driver, except for the fields expressing an average value (Average speed, Average fuel consumption). For these fields the weighted mean is calculated. Only values with a green confidence indicator are used to calculate these values.
Please note that a report may cover several pages, so it is possible that part of the results is on the next page.


