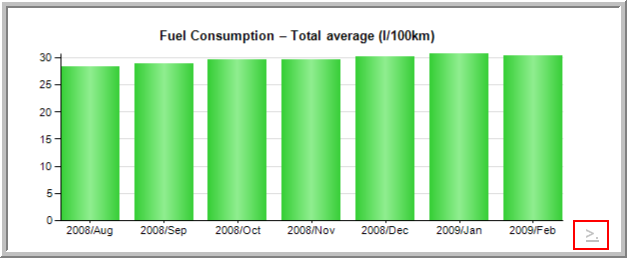
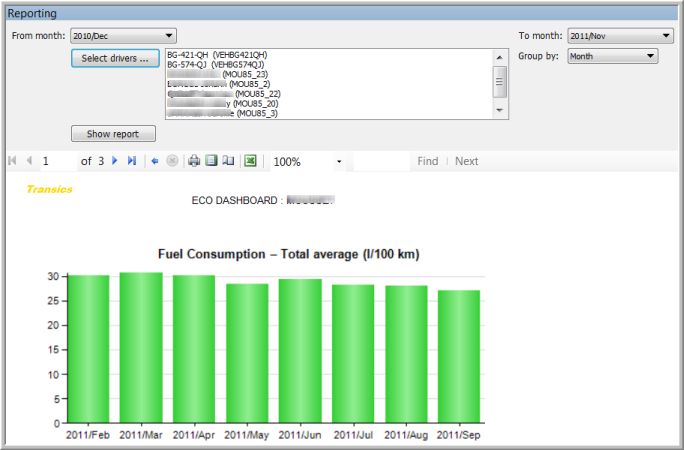
A graph of:
-
Fuel consumption – Total average (l/100km)
-
Fuel consumption - Total average (km/l)
-
Fuel consumption – Total (l)
-
Fuel consumption – Idling (l)
-
Distance (km)
-
Duration – Driving (hrs)
-
Duration – Idling (hrs)
-
Speed average (km/h)
-
CO2 emission (t)
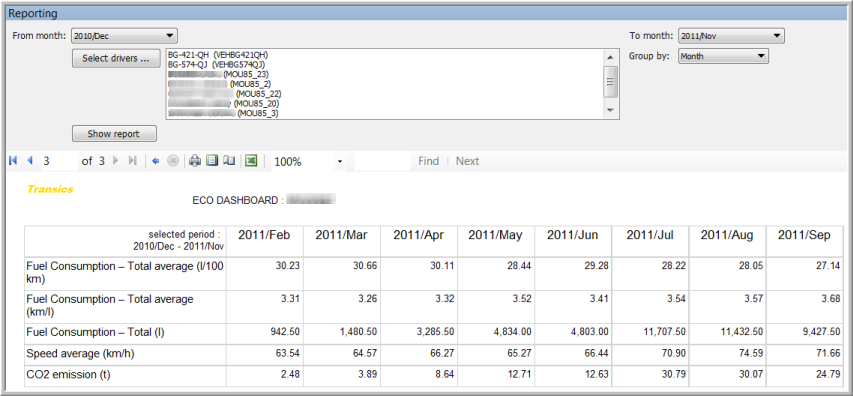
A table view of the graphs
 to return to the main screen and click on the wanted report.
 .
.