|
TRIP ASSESSMENT |
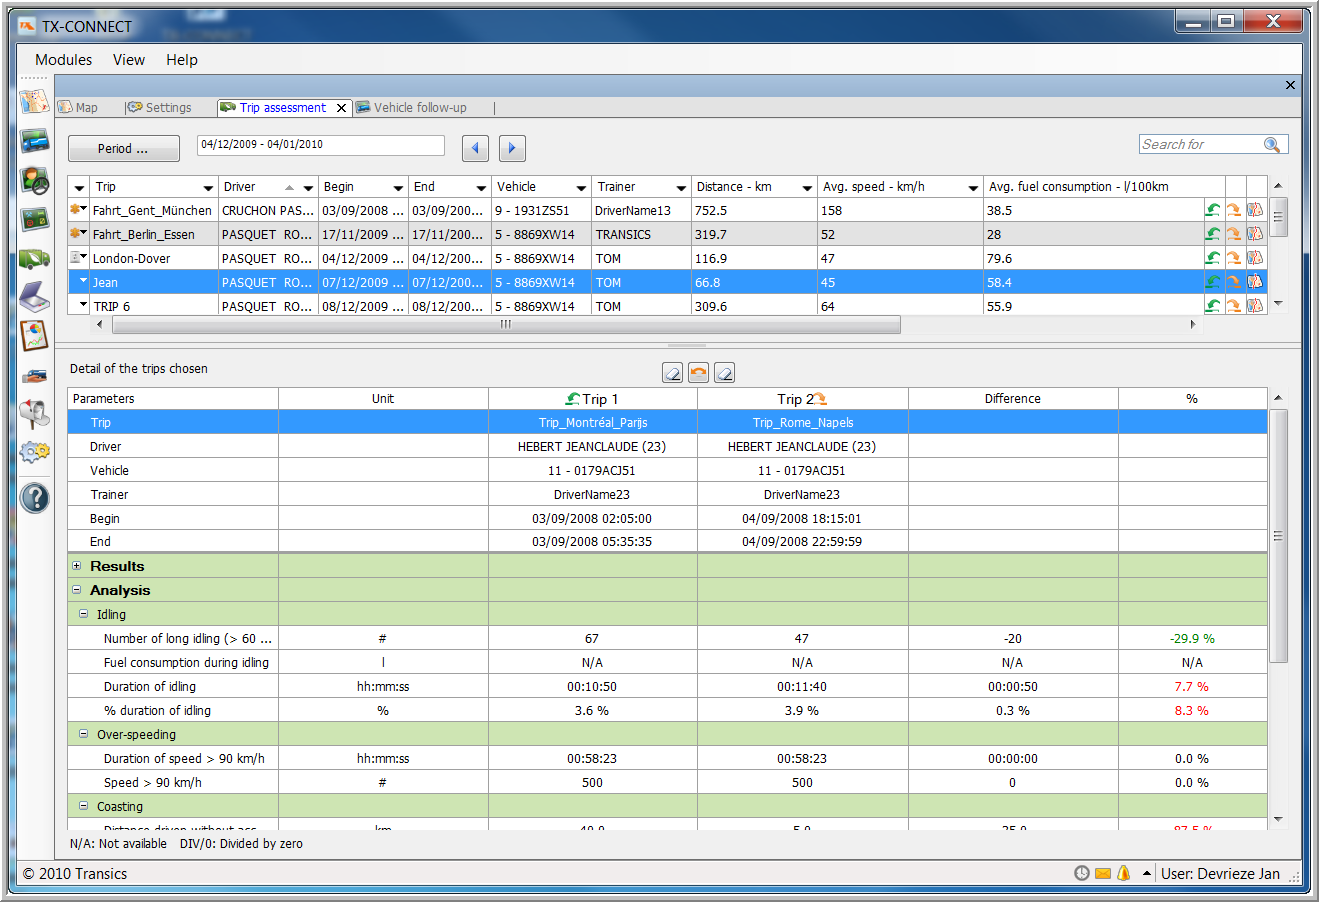
The window consists of two zones:
- In the upper part, you have an overview of the training trips during a certain period.
- In the lower part, the details of one or two selected trips are displayed.
Please note:
You will only see this information for the drivers you follow up, which can be set in Settings - Tracking - Who tracks what - tab page Drivers.
When you have a database with version lower than 20.02, you will get the message "Feature not supported". For more information or to purchase this feature, please contact your Transics project leader, or Transics support.
|
TRIP OVERVIEW |
The first time you consult this overview, the data shown will be by default from the last 7 days. When clicking the Period button, you can modify this period to either from day x until day y, or to the last x days. This period is limited to 99 days.
The overview includes the following columns:
Trip status
In the "Trip status" column, you can sort and filter all trips using the drop-down menu.
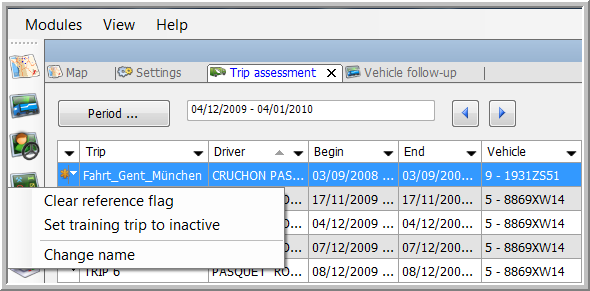
It is also possible to:
 Set the trip as a reference trip / clear the reference flag
This allows you to compare a certain trip you consider to be a reference with another trip. A reference trip remains visible in the Trip overview, whatever period is selected.
 Set the trip to inactive / active
You can activate or deactivate trips to be able to filter your trips more accurately.
Change the name of the trip
Name of the trip
Driver
Vehicle
Begin time of the trip
End time of the trip
Average fuel consumption (l/100km)
Average fuel consumption (km/l)
Name of the trainer
Distance (kilometres)
Average speed (km/h)
To save this overview as an Excel file or PDF document:
|
|
Right-click in the table and select “Export data”. |
|
|
|
|
|
Select the columns you want to export. |
|
|
|
|
|
While the system is retrieving the data, you will see a waiting message. |
|
|
|
|
|
A report viewer will open. Click on the Excel or PDF icon to save your result as an Excel file or a PDF document. |
|
DETAILED TRIP INFO |
To get detailed information about a trip, click on the  button in the upper part of the screen.
If you want to compare two trips, e.g. the trip before and the trip after a training or a trip from two different drivers, you should also click on the  button.
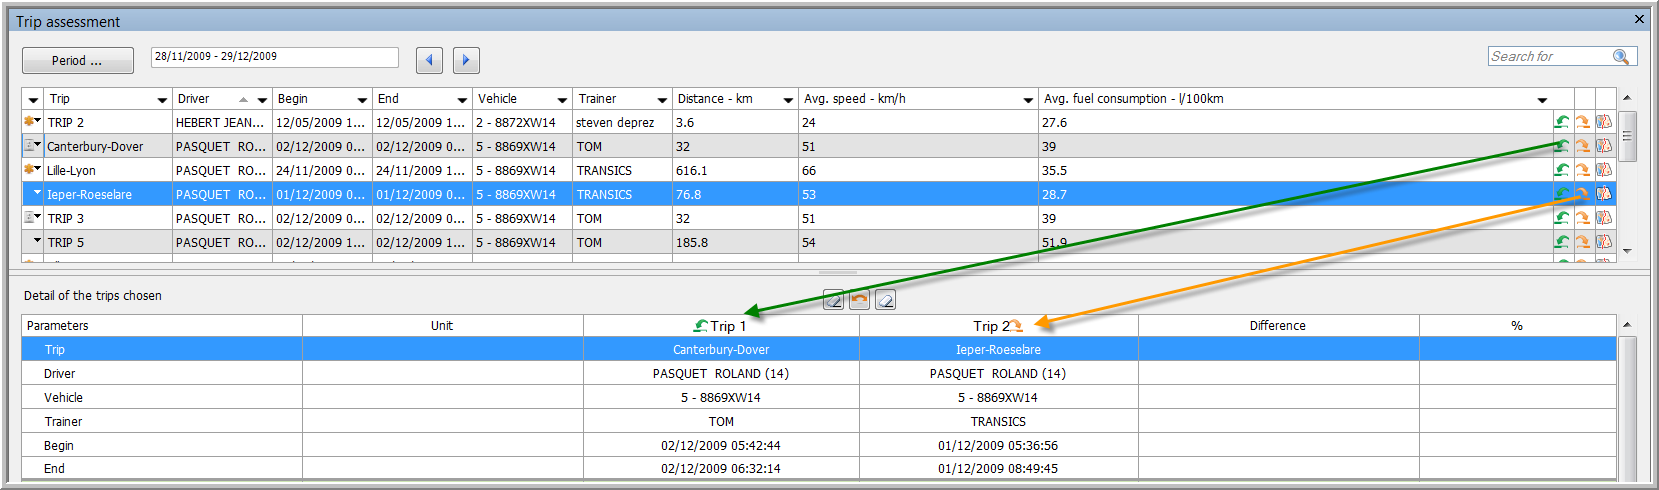
The difference between both trips will be displayed in (absolute) numbers (see “Difference” column) and in percentage (see “%” column). In case of improvement, the "%" column will be indicated in green (this is only the case for the most relevant parameters). In case of deterioration, this column will be indicated in red.
The detailed trip overview is divided into several categories and you have different parameters per category.
Remark: When you right-click in this detailed overview, you can collapse or expand all folders.
Results
Distance (kilometres)
Duration of the trip (hh:mm:ss)
Duration of driving (hh:mm:ss)
Total fuel consumption (litres)
Average fuel consumption (l/100km)
Average fuel consumption (km/l)
Total RPM
Average RPM
Average CO2 emission (kg/100 km)
Average speed (km/h)
Analysis (To discover the parameters, click on a subcategory. A pop-up with the parameters will appear. To close the pop-up, click in it, but not on the screenshot.)
You can clear the information about a trip, clicking on the Reset trip 1 or Reset trip 2 button.
If you click on the Switch trips button, the information on the second trip will move to the first column, and vice versa.
It is also possible to save this overview as an Excel file or PDF document. To do so, right-click in the overview and select "Export data". The report will be automatically generated. To save it, click on the Excel or PDF icon.


