The "ECO driving" module contains the Trip assessment and Driver assessment menu (TX-SKY and mixed fleet only - not active by default).
|
ECO DRIVING |
|
|
The "ECO driving" module contains the Trip assessment and Driver assessment menu (TX-SKY and mixed fleet only - not active by default). |
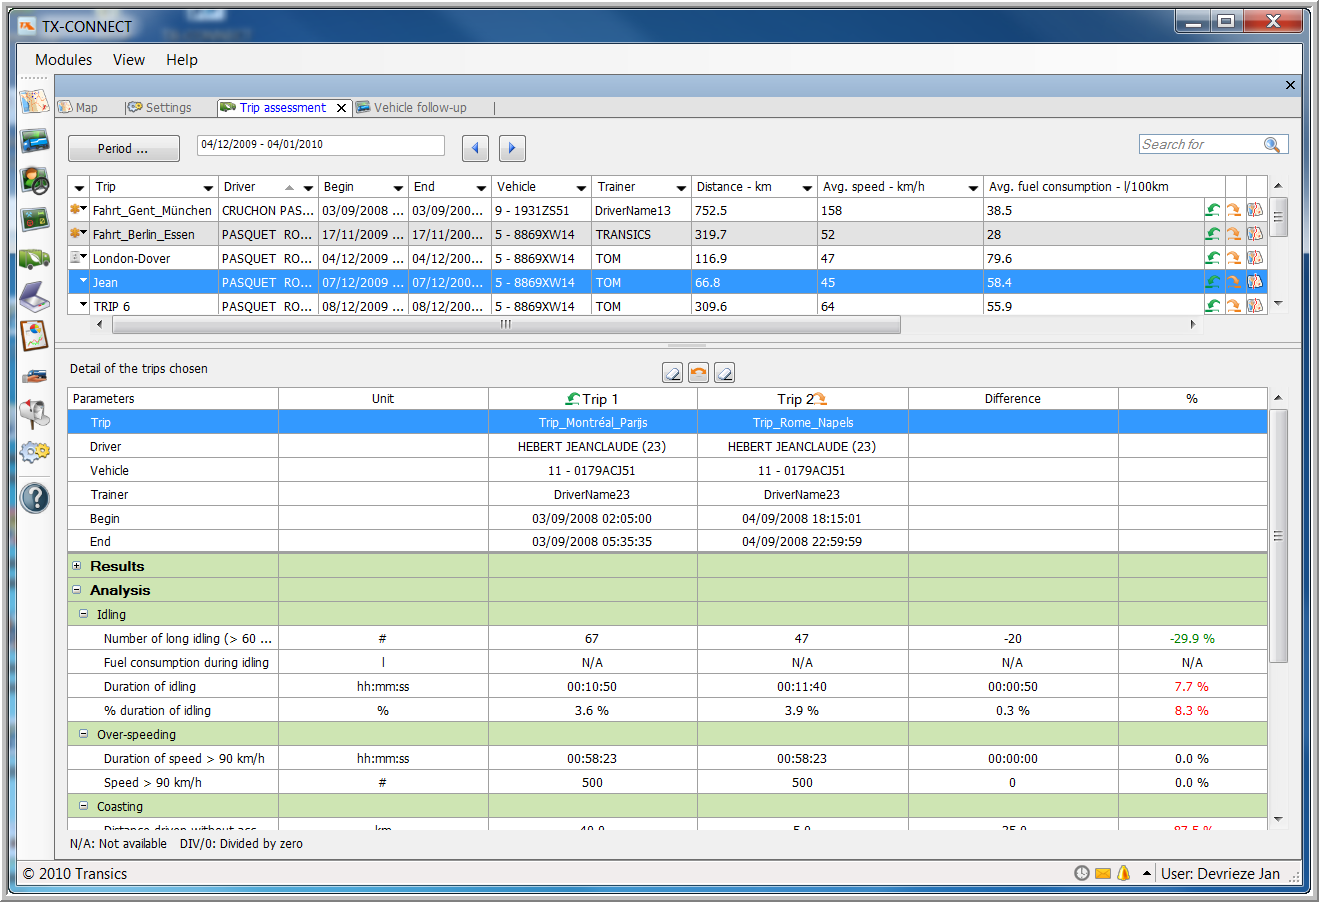
The window consists of two zones:
§ In the upper part, you have an overview of the training trips during a certain period.
§ In the lower part, the details of one or two selected trips are displayed.
Please note:
You will only see this information for the drivers you follow up, which can be set in Settings - Tracking - Who tracks what - "Drivers" tab page.
Click on the Period button to change this period to either from day x until day y, or to the last x days. This period is limited to 99 days.
The overview includes the following columns:
§ Trip status
In the "Trip status" column, you can sort and filter all trips using the drop-down menu.
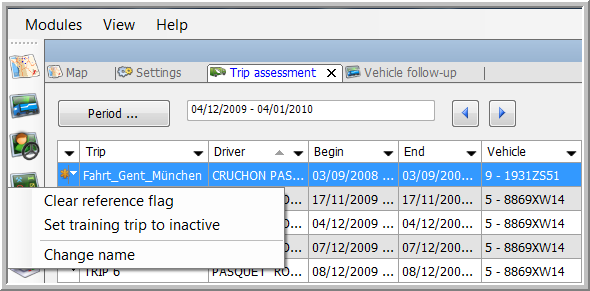
It is also possible to:
o ![]() Set the trip as a reference trip / clear the reference flag
Set the trip as a reference trip / clear the reference flag
This allows you to compare a certain trip you consider to be a reference with another trip. A reference trip remains visible in the "Trip overview", whatever period is selected.
o ![]() Set the trip to inactive / active
Set the trip to inactive / active
You can activate or deactivate trips to be able to filter your trips more accurately.
o Change the name of the trip
§ Name of the trip
§ Driver
§ Vehicle
§ Begin time of the trip
§ End time of the trip
§ Average fuel consumption (l/100 km)
§ Average fuel consumption (km/l)
§ Name of the trainer
§ Distance (kilometers)
§ Average speed (km/h)
|
To get detailed information about a trip, click on the If you want to compare two trips, e.g. the trip before and the trip after a training or a trip from two different drivers, you should also click on the |
|
Switch trips
|
|
Reset trip 1 / 2
|

The difference between both trips will be displayed in (absolute) numbers (see the “Difference” column) and in percentage (see the “%” column). In case of improvement, the "%" column will be indicated in green (this is only the case for the most relevant parameters). In case of deterioration, this column will be indicated in red.
The detailed trip overview is divided into several categories and you have different parameters per category.
Note: Right-click in this detailed overview to collapse or expand all folders or to export the report data (cf. Export data).
Results
§ Distance (kilometers)
§ Duration of the trip (hh:mm:ss)
§ Duration of driving (hh:mm:ss)
§ Total fuel consumption (liters)
§ Average fuel consumption (l/100 km)
§ Average fuel consumption (km/l)
§ Total RPM
§ Average RPM
§ Average CO2 emission (kg/100 km)
§ Average speed (km/h)
Analysis
Idling
Number of long idling (#)
Fuel consumption during idling (l)
Duration of idling (hh:mm:ss)
Duration of idling (%)
Overspeeding
Duration of speed > x km/h (hh:mm:ss)
Speed > x km/h (#)
Coasting
Distance driven without accelerator pressed (km)
Duration of driving without accelerator pressed (hh:mm:ss)
Cruising
Distance cruise control (km)
Duration cruise control (hh:mm:ss)
Anticipation
Number of stops (#)
Number of brakings (#)
Number of panic brakings (#)
Distance travelled by braking (km)
Duration travelled by braking (hh:mm:ss)
Duration retarder (hh:mm:ss)
Duration high RPM no fuel (hh:mm:ss)
Gearing
Number of gearings (#)
Number of gearings (upwards) (#)
Average position of the accelerator (%)
Maximum position of the accelerator (%)
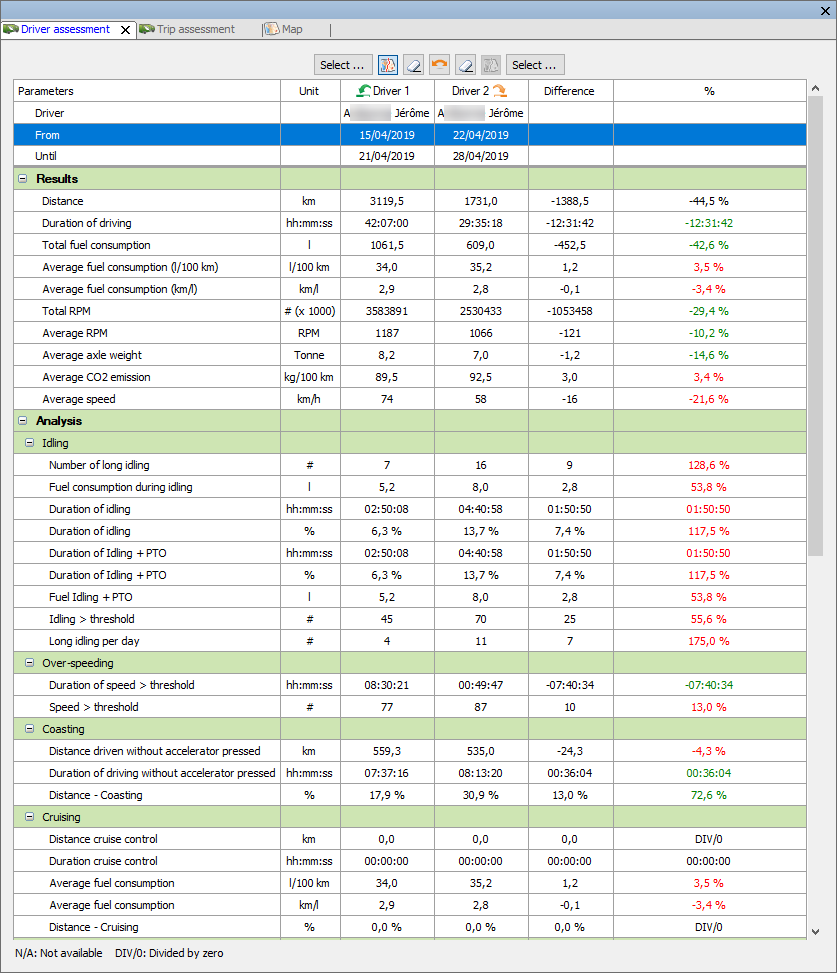
Use the options in the top bar to generate the desired overview: 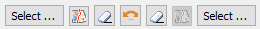
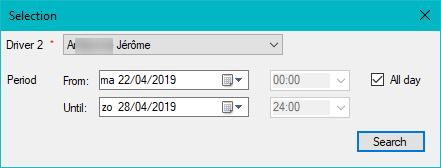
Driver / Period selectionIn the top bar, click on the Select ... buttons to select driver 1 and driver 2 and the desired period. You can compare the same driver for two different periods or two drivers for a specific period. Click on Search to add the available data to the report (cf. "Results").
Note: You will only see the drivers you follow up, which can be set in Settings - Tracking - Who tracks what - "Drivers" tab page. The selected period may not exceed 7 days. |
|
Show on map
|
|
Switch drivers
|
|
Reset driver 1 / 2
|
|
The differences between both trips will be displayed in (absolute) numbers (see the “Difference” column) and in percentage (see the “%” column). In case of improvement, the "%" column will be indicated in green (this is only the case for the most relevant parameters). In case of deterioration, this column will be indicated in red.
The detailed trip overview is divided into several categories and you have different parameters per category.
Note: Right-click in this detailed overview to collapse or expand all folders or to export the report data (cf. Export data).
|
Parameters
Results
Analysis
|
 |
To save an overview as an Excel file or a PDF document:
1. Right-click on the table and select “Export data”. The report wizard will be opened.
2. Click on the Excel icon to save your result as an Excel file or click on the printer icon to print the document (e.g. as a PDF).