The ECO DASHBOARD provides:
|
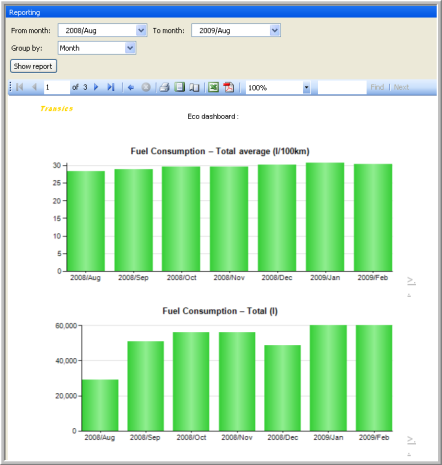
A graph of:
-
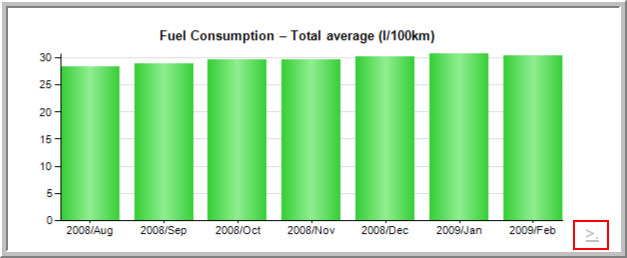
Fuel consumption – Total average (l/100km)
-
Fuel consumption – Total (l)
-
Fuel consumption – Idling (l)
-
Distance (km)
-
Duration – Driving (hrs)
-
Duration – Idling (hrs)
-
Speed average (km/h)
-
CO² emission (t)
|
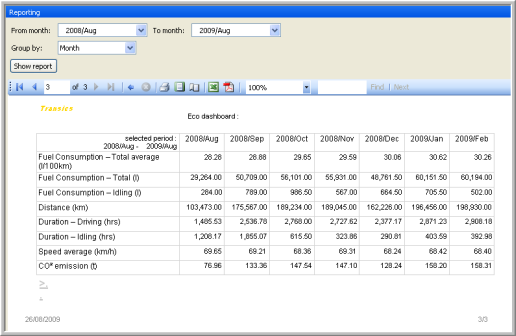
A table view of the graphs
|
|
|
These graphs are available for the entire fleet, for each vehicle and driver separately and this on a weekly or monthly basis. To scroll between these graphs, use the back button  to return to the main screen and click on the wanted report.
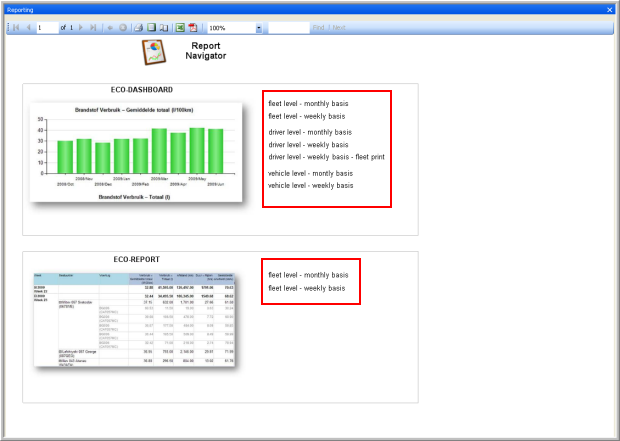
It is possible to scroll from a graph or from the table to the ECO REPORT. To do so, click on  .
.
You can save these graphs as an Excel file or a PDF document. Therefore, click on the corresponding button.
